Next-generation spatial views
The next generation of spatial and layerController views in Vitessce is ready for testing. There are several motivations for re-implementing these views:
- Support a more flexible coordination model
- Support multi-channel segmentation bitmasks
- Support per-obsType segmentation bitmasks
- Use semantically-meaningful data types for points and spots
- Unify the visualization properties for polygon and bitmask segmentations
These views are available in JS package v3.2.0 as spatialBeta and layerControllerBeta.
Note: automatic initialization of the coordination space is not yet supported.
We suggest using the object-oriented VitessceConfig API (and the new linkViewsByObject method) to manually initialize the values.
Flexible coordination model
Previously, the spatial view used two coordination types spatialSegmentationLayer and spatialImageLayer which required an array of nested objects as values.
Usage of nested objects as coordination values prevents coordination of a subset of those values.
For example, this prevented coordinating channel colors while not coordinating other properties such as channel intensity windows.
In contrast, spatialBeta and layerControllerBeta are more flexible because they use multi-level- and meta- coordination to achieve the configuration of hierarchical properties including image layers and channels.
In the base case of the single-level coordination model, each view can be mapped to a set of coordination scopes, one scope per coordination type. Multi-level coordination extends this model by allowing each coordination scope to itself have its own set of coordination scope mapping, generating a new "level" of coordination.
For example, it allows each image layer coordination scope to be mapped to its own coordinated properties such as opacity and visibility. Meanwhile, the opacity and visibility properties remain primitive numeric and boolean values, respectively, which are agnostic to the existence of any image layer.
Other benefits:
- Ability to configure global Z/T/C indices for coordination of spatial/temporal/channel selections across data types, datasets, or views
- Ability to configure 3D vs. 2D mode globally (i.e., per-view, as opposed to per-image layer).
- Ability to fall back to coordination values in the previous level (if not initialized in the subsequent level).
A disadvantage of this more flexible coordination model is that it requires a more complex JSON representation that is tedious to write and reason about. To address this, we have extended our object-oriented configuration APIs:
- VitessceConfig.linkViewsByObject
- VitessceConfig.addCoordinationByObject
- VitessceConfig.addMetaCoordination
- VitessceConfigView.useCoordinationByObject
- VitessceConfigView.useMetaCoordination
- VitessceConfigMetaCoordinationScope
- CoordinationLevel
The resulting VitessceConfig instance can be converted to JSON.
Multi-channel, per-obsType segmentation bitmasks
The flexible coordination model described above enables data-related properties such as obsType ("observation type") to be mapped per-image-channel.
In other words, for segmentation bitmask images, each bitmask channel can represent a different type of observation.
For example, channel zero can contain nucleus segmentations, while channel one contains cell segmentations, and channel two contains glomerulus (or other functional tissue unit) segmentations.
Thus, obsType can be used to join multiple data types together, as described in our previous blog post (but now on a per-channel basis).
For example, the obsType: 'cell' channel might have its own obsSets for cell type annotations,
while the obsType: 'glomerulus' channel has its own obsSets for annotation of which glomeruli are globally sclerotic vs. non-globally sclerotic.
For more details about data storage, see data-conventions/multi-channel-label-images.
obsPoints and obsSpots data types
The new data types obsPoints and obsSpots enable more straightforward configuration of visualizations containing point-based measurements (e.g., MERFISH transcript points) and spot-based measurements (e.g., Visium spots).
While the data representations for points and spots are currently identical (XY coordinates), the more semantically-meaningful nature of the data type names helps to infer (from the Vitessce configuration) how each should be visualized.
For example, points have a fixed size in pixels as opposed to a physical size (i.e., "dimensionless"), while spots have a configurable physical size which is reflected by changes in pixel size during zoom interactions.
These data types also more closely reflect SpatialData's point and (circle) shape Elements, which will make SpatialData support more straightforward to implement.
Unified visualization properties for segmentations
Vitessce supports both polygon- and bitmask-based segmentations. Previously, these different types of segmentations had to be configured differently, with polygon segmentations supporting a custom object like
{ opacity, radius, visible, stroked }
while bitmask segmentations supported same nested array of image properties as the image data type.
In addition to exposing details about the internal implementations of the visualizations, these different configurations added complexity to the controls for segmentations, making them dependent on knowledge of the segmentation type.
In part, these differences were related to the fact that the previous spatial view did not support a stroked: true/false property for bitmask-based segmentations.
This limitation led to the need to pre-compute and redundantly store both filled and stroked segmentations:
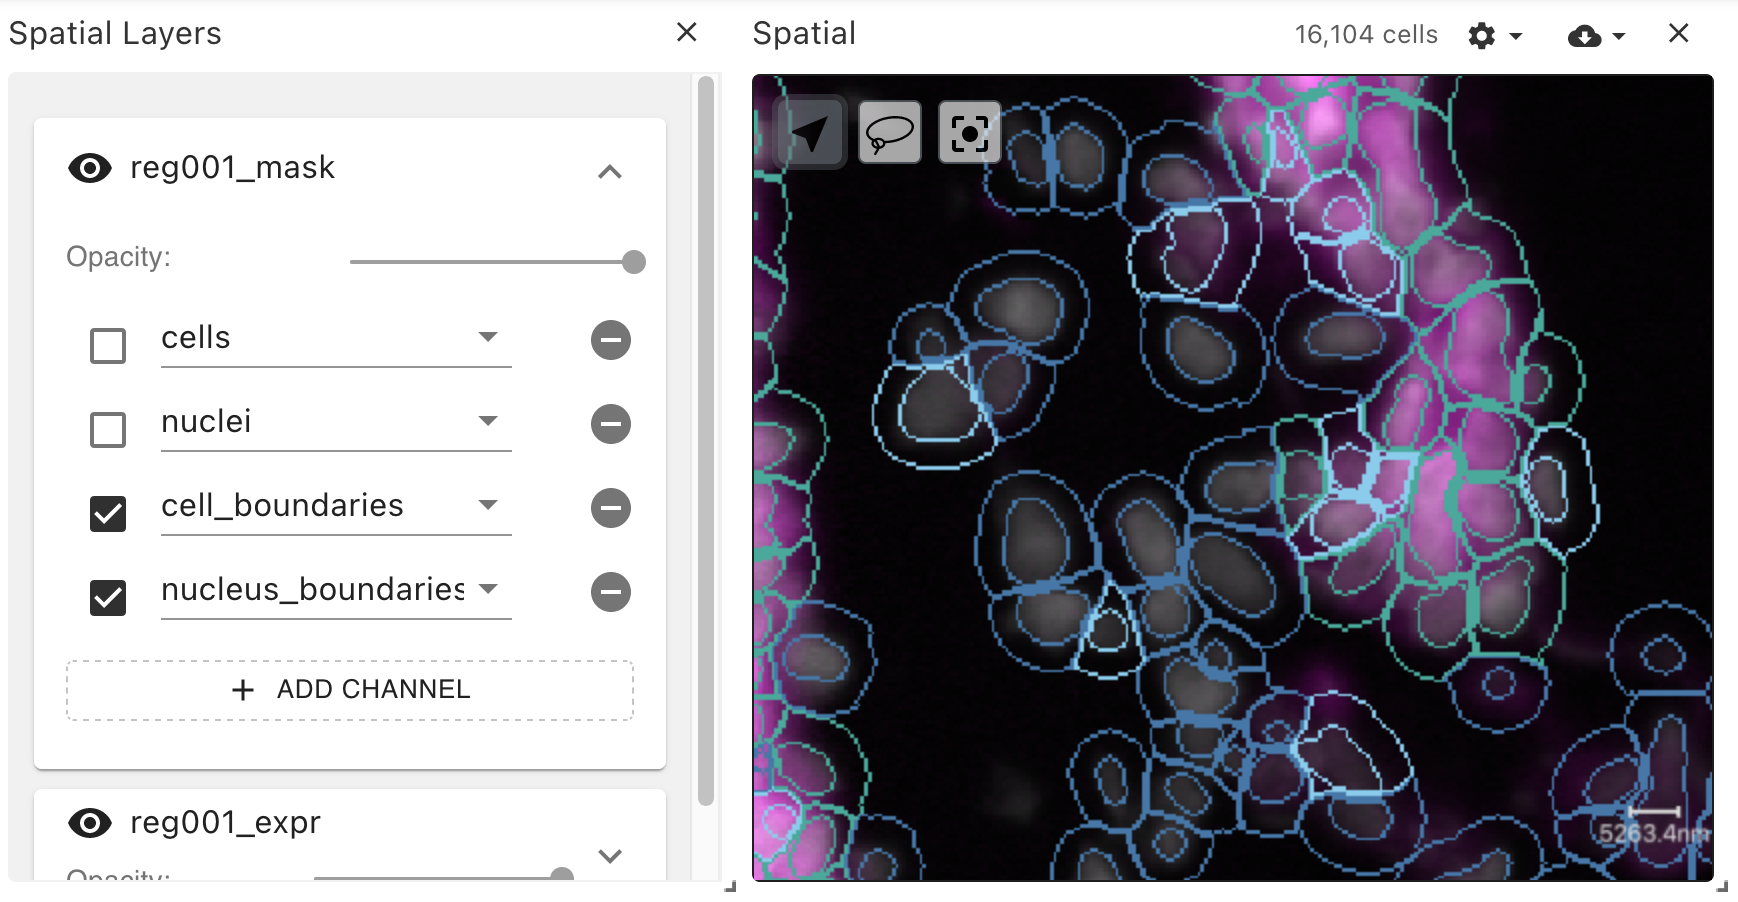
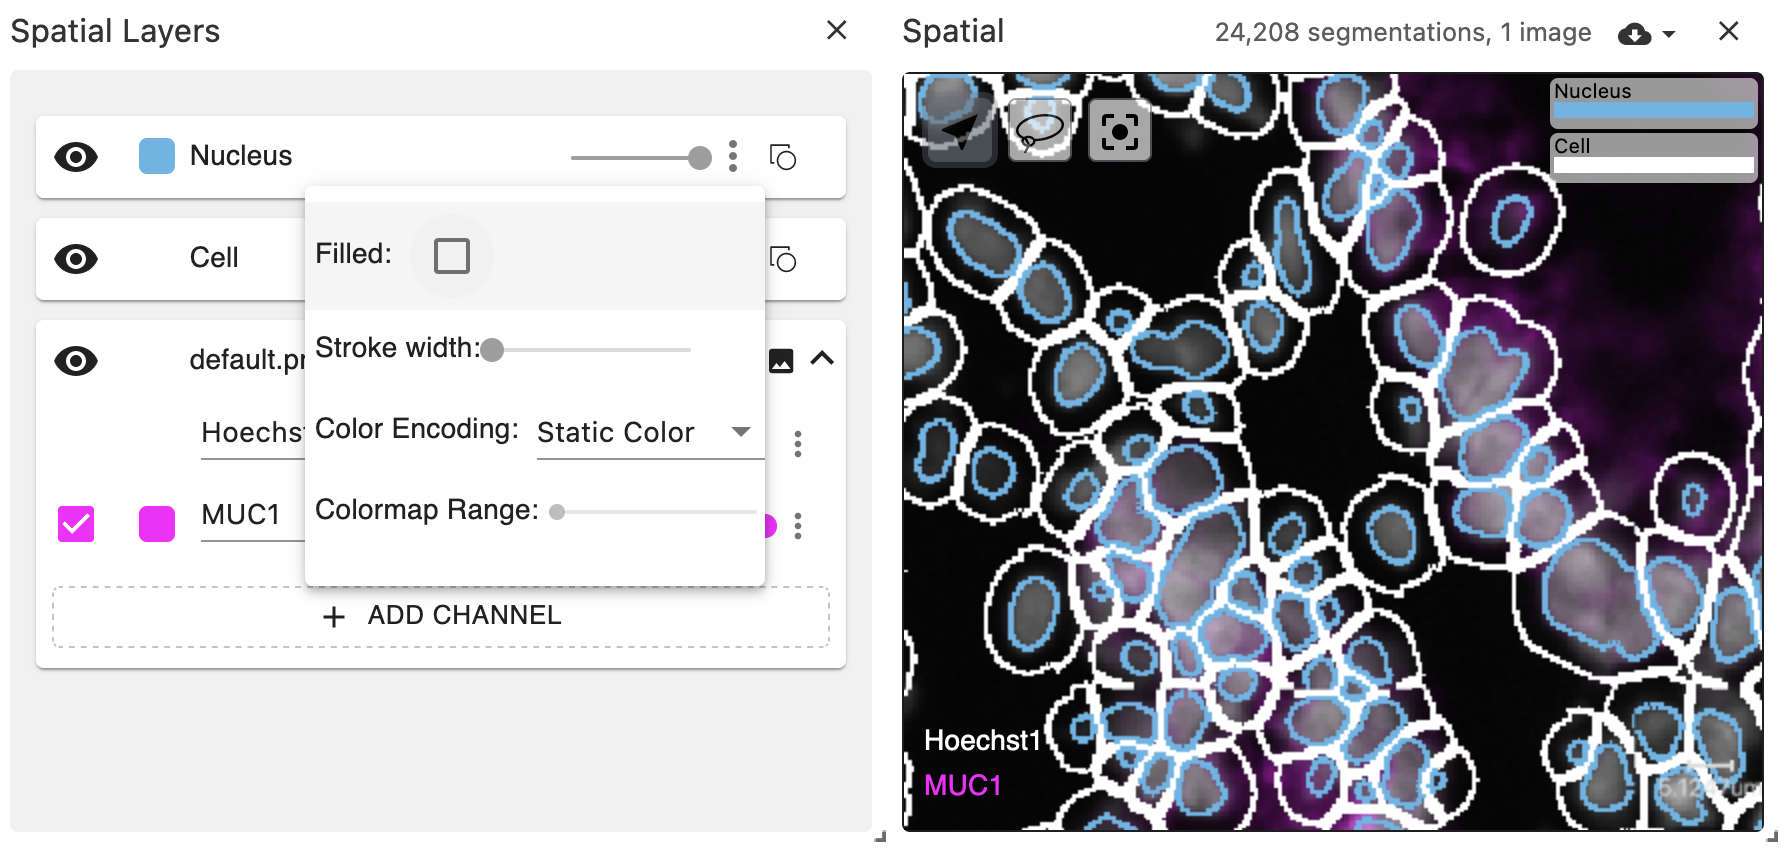
The new spatial view implementation supports on-the-fly stroked: true/false for bitmask-based segmentations, with configurable stroke width.
Using multi-level coordination, the same visual properties can be configured for both polygons and bitmasks.
The boundaries of bitmask observations are computed on the GPU using a custom DeckGL layer.
Note: the GPU-based boundary visualization is based on a heuristic and is not perfect. Parts of bitmask boundaries that are close to image tile boundaries have the potential to be under-drawn (because the shader only has access to the data for one tile at a time). Boundaries that are concave may also be under-drawn. However, the boundary will never be over-drawn (i.e., pixels will not be rendered that would lie outside of the boundary if it had been rendered perfectly). The imperfections are more noticible at higher zoom levels. In the future, strategies such as multi-pass rendering of staggered tiles could resolve these limitations.
Demos
We have configured several examples which make use of the spatialBeta and layerControllerBeta views:
- RGB image
- Multiplex + 3D image
- Comparison of volumetric rendering algorithms
- Visium with obsSpots data type
- osmFISH with obsPoints data type
- Bitmask-based obsSegmentations for cells and nuclei
- Bitmask-based obsSegmentations for functional tissue units
- Bitmask-based obsSegmentations for functional tissue units with coordinated opacity
Usage from Python
We have implemented object-oriented APIs for the multi-level coordination model in both JavaScript and Python.
The equivalent of the linkViewsByObject function from JS is the link_views_by_dict function in Python.
This enables initialization of the coordination space using the same patterns in both languages.
Jupyter notebooks demonstrating usage of the Python API are available in the documentation website for the vitessce Python package.
Next steps
There are some remaining features to implement, including a mechanism for automatic initialization of the multi-level coordination values based on the data configuration.
If testing goes smoothly, we plan to replace the current spatial and layerController views with their Beta counterparts.
We would do this in a new major version due to the UI differences, but this would be implemented as a non-breaking change with automatic upgrade functions to internally convert previously-configured visualizations (in the same way we have implemented upgrade functions for all prior introductions of new config schema versions).